Welcome to STJ Metric’s documentation!
This is a project to locate the Subtropical Jet, using the gradient of the dynamical tropopause (an iso-potential vorticity surface of 2 PVU), extensible to other methods.
Code hosted at https://github.com/mkstratos/stj_pv
The paper describing the results of this study have been submitted and are under review at Climate Dynamics.
The stj_diag module can produce details about how the jet is found, like the figure below.
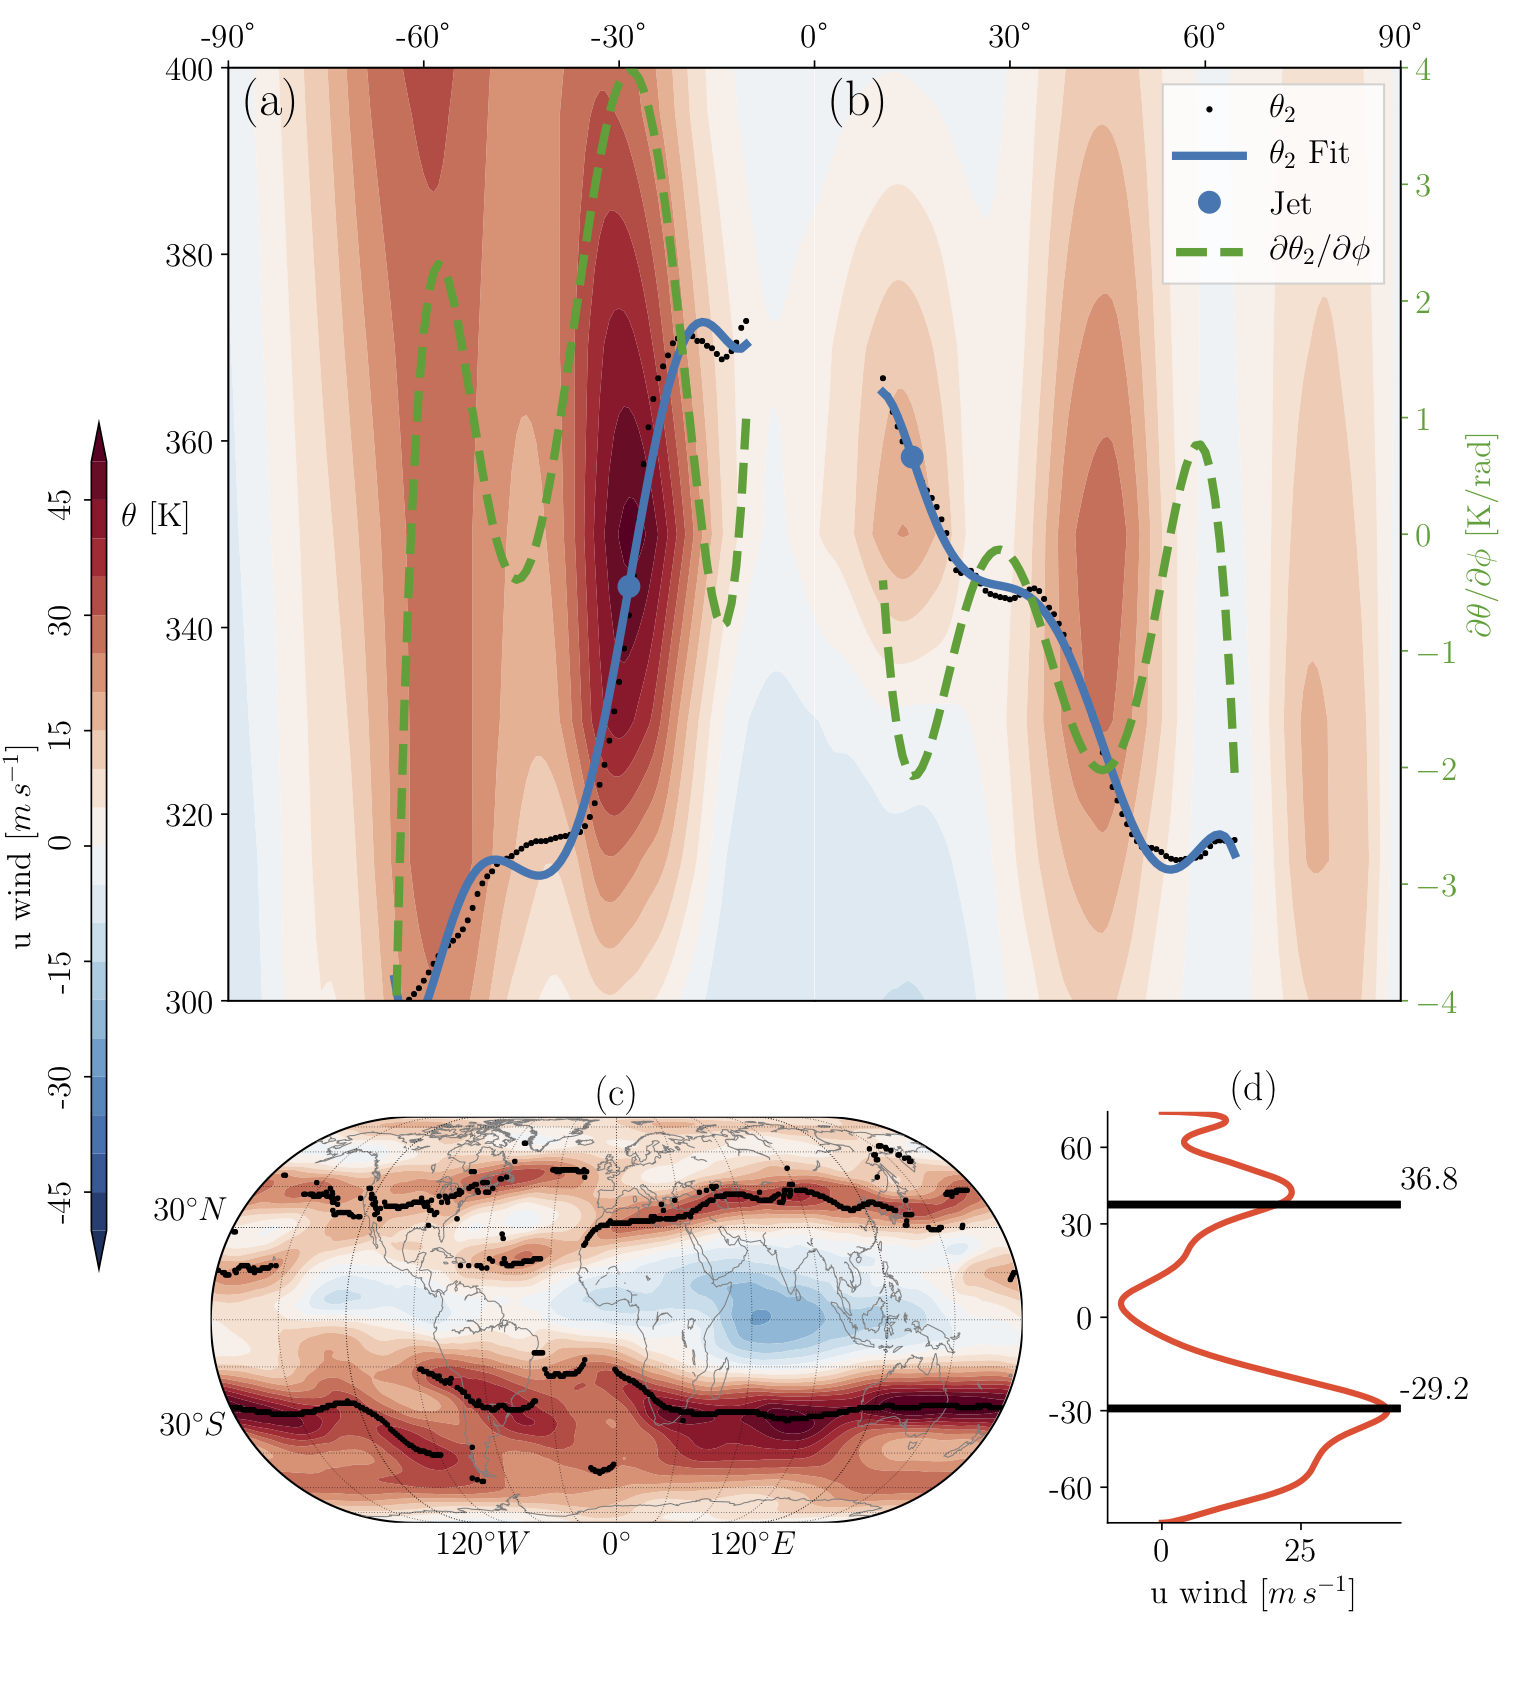
An example of the tropopause gradient method for June 2015 using monthly ERA-I data for a single longitude, 180˚, for the (a) SH and (b) NH. The left y-axis is potential temperature (\(\theta\)) and right y-axis (green) its derivative with respect to latitude (\(\partial\theta / \partial\phi\)). The dynamic tropopause potential temperature (\(\theta_2\)) is shown with black “.” marker, the solid blue line is the polynomial fit to \(\theta_2\), the dashed green line is the meridional gradient of the potential temperature of the dynamical tropopause, and the blue solid circle is the identified subtropical jet position. Contours are the isentropic zonal-wind for context only (not part of the algorithm). The zonal wind on the 350 K isentropic surface is shown in panel (c) with the identified subtropical jet for each longitude in black. In panel (d) the black line is the zonal mean of the subtropical jet latitudes (\(\phi_{NH}=36.8\) ˚N, \(\phi_{SH}=29.2\) ˚S) and the orange line is the zonal mean zonal wind at 350K for context only (not part of the algorithm). The colour bar relates to plots (a-c).
Contents: